Capabilities
Data and insight
Turn sample data, a CSV file or an existing schema into a live, governed dataset with saved queries, dashboards and a written business meaning.
- Everyone
Last reviewed
Flexday AI turns the data you already have into a live, queryable dataset that apps, workflows and AI agents can all read from. You bring sample rows, a CSV export or an existing database schema; the platform works out what the data means, creates a real database for it and loads your rows. On top of that you get saved queries, dashboards and, if you want it, a measured profile and a business description of the data.
What you can do
- Turn a spreadsheet export into a live dashboard. Attach a CSV or JSON file in the Builder and ask for the views you need; the rows are loaded exactly as you sent them and the charts, tables and maps read them live.
- Bring an existing schema. Paste a
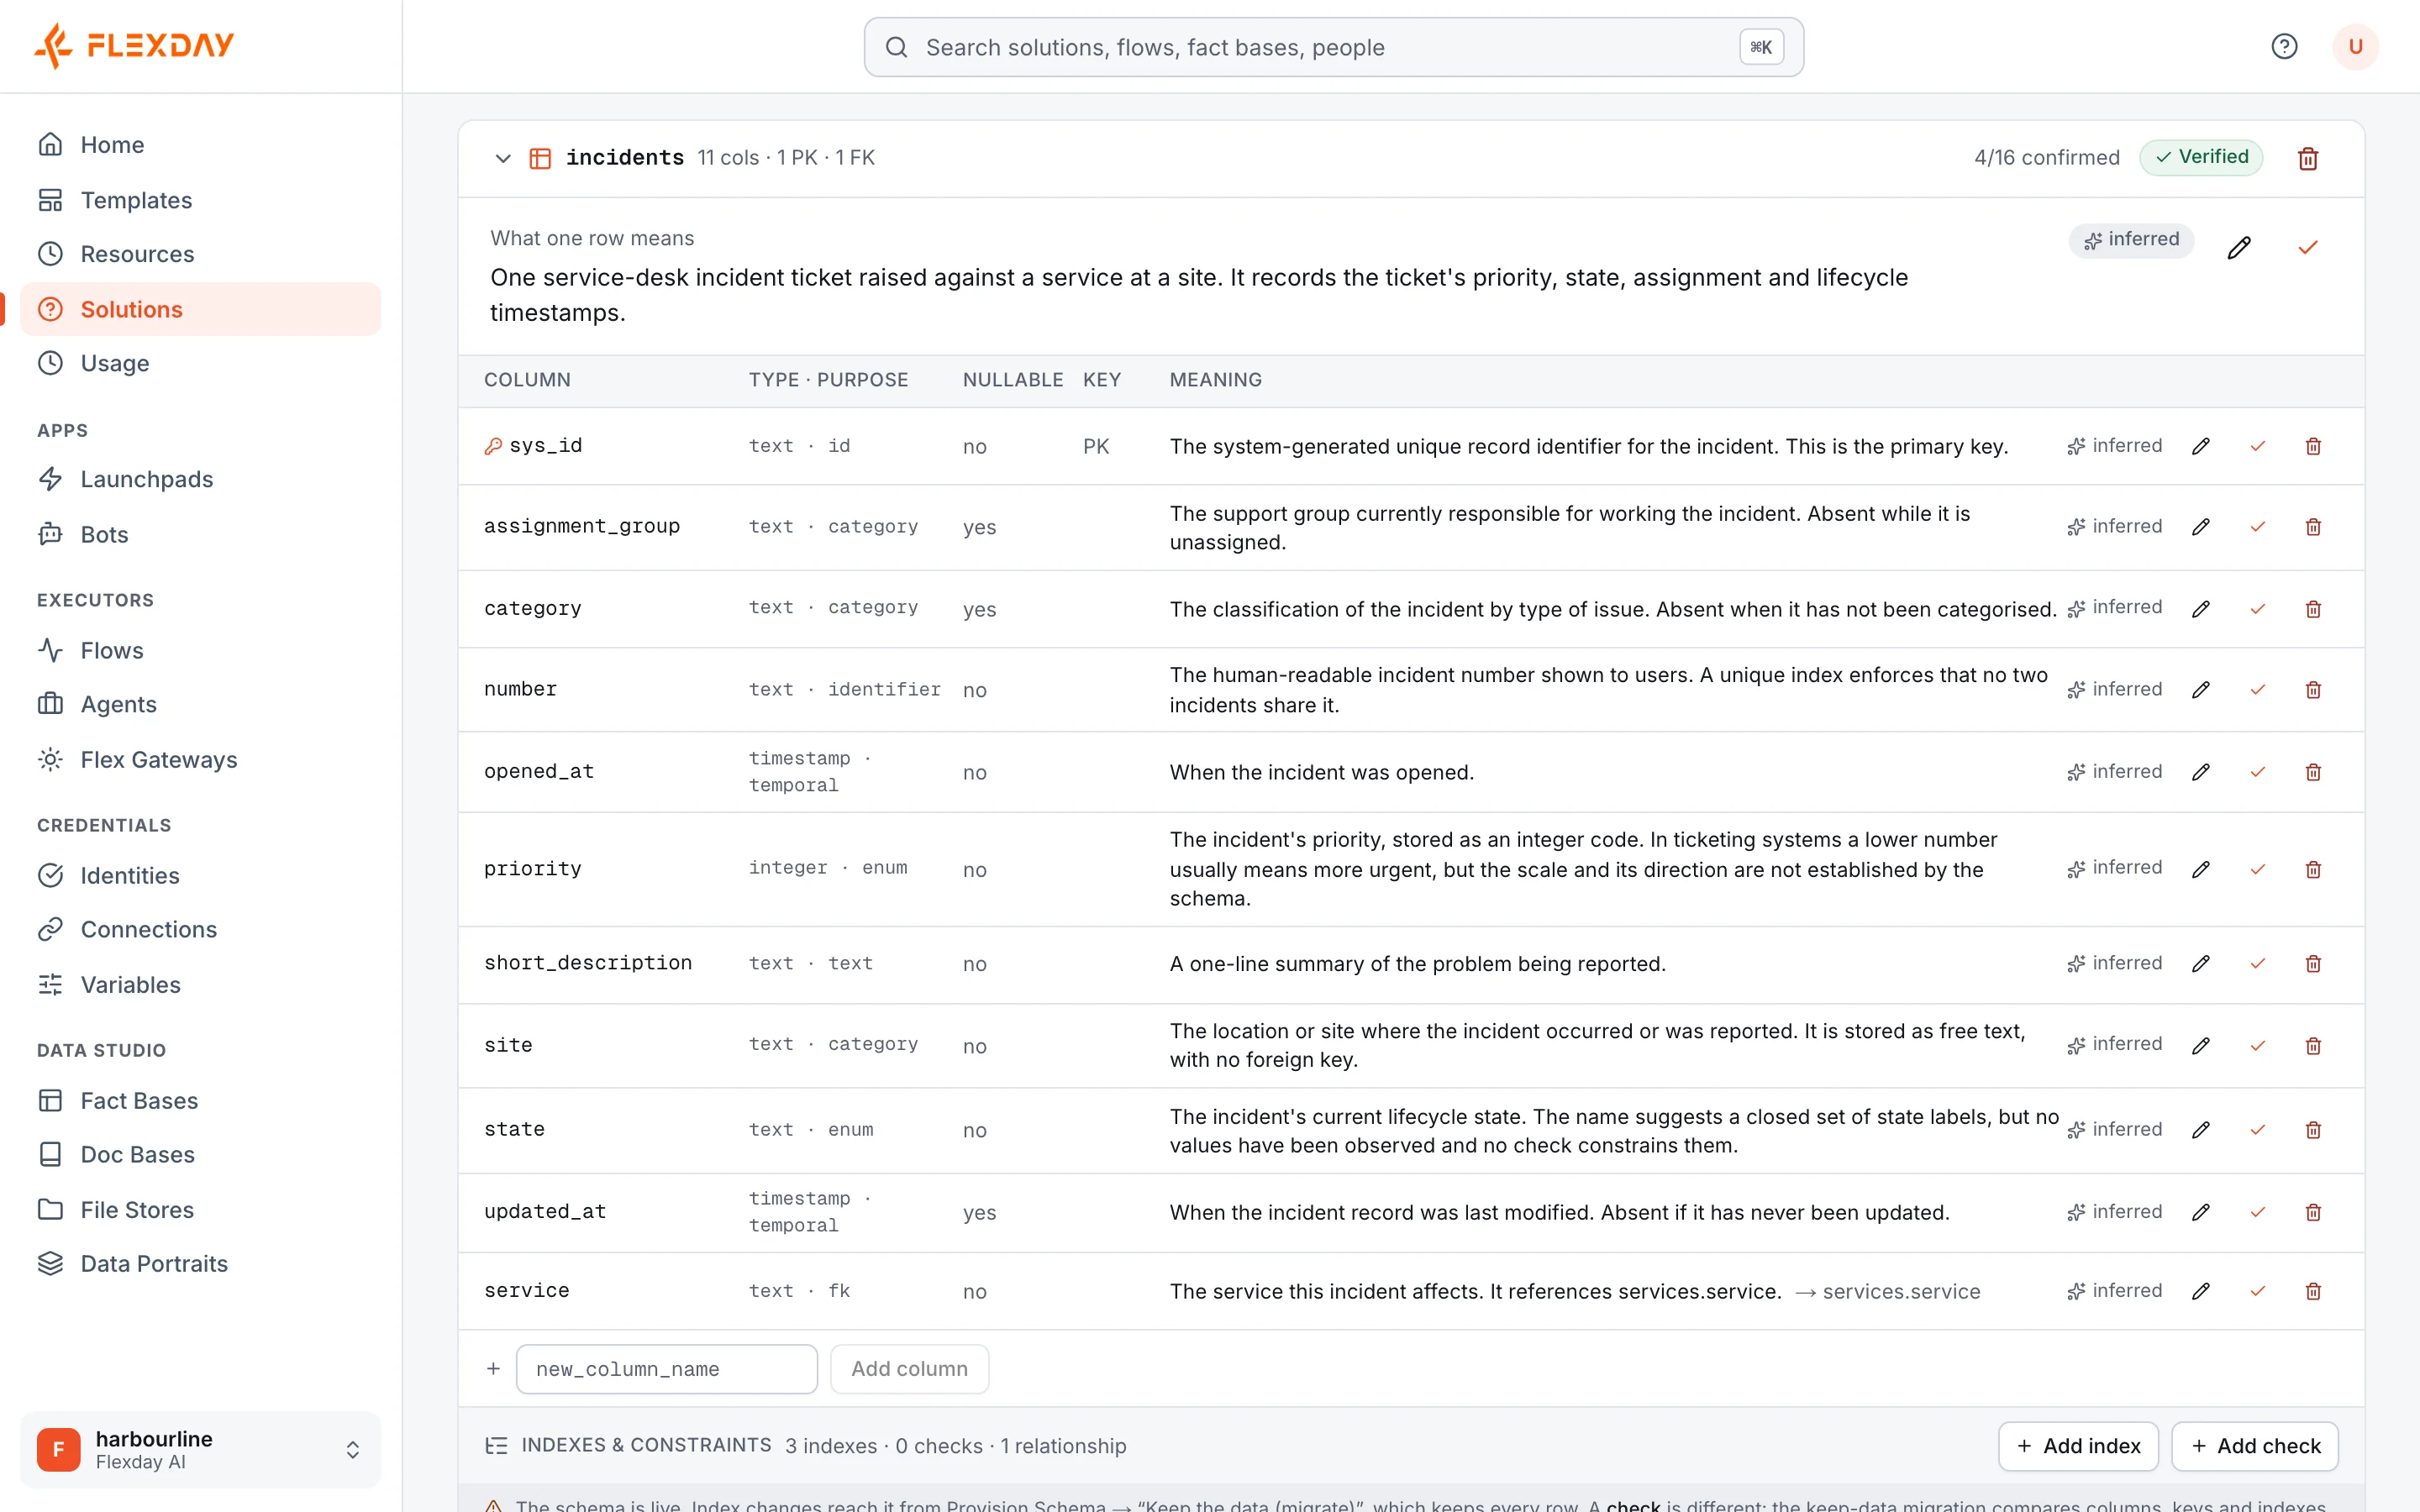
CREATE TABLEscript and it is parsed, not guessed at, with a report of what was kept, translated or left out. - Get a business definition. AI proposes keys, relationships, constraints and plain-language descriptions for every table and column, which you can review and confirm; a Fact Base the Builder creates is accepted for you. Constraints, indexes and relationships you wrote yourself survive a later re-inference; descriptions are regenerated.
- Ask the same question many ways. Saved queries with named parameters feed apps, Flows and Agents from one definition of the truth. When the Builder builds an app, its read queries become API endpoints automatically, and a read query you save by hand gets one when the Builder next finishes a build on that app, or when you add it; any query that changes data needs an endpoint added on purpose.
- Show each person only their rows. Row policies limit which rows a signed-in end user can see or change: their own, those tagged for their audience, or rows matching a custom condition.
- Change the shape safely. A schema change is planned first and applied all-or-nothing, exactly as planned. In the Studio you approve the plan; the Builder describes it in the chat and then applies it.
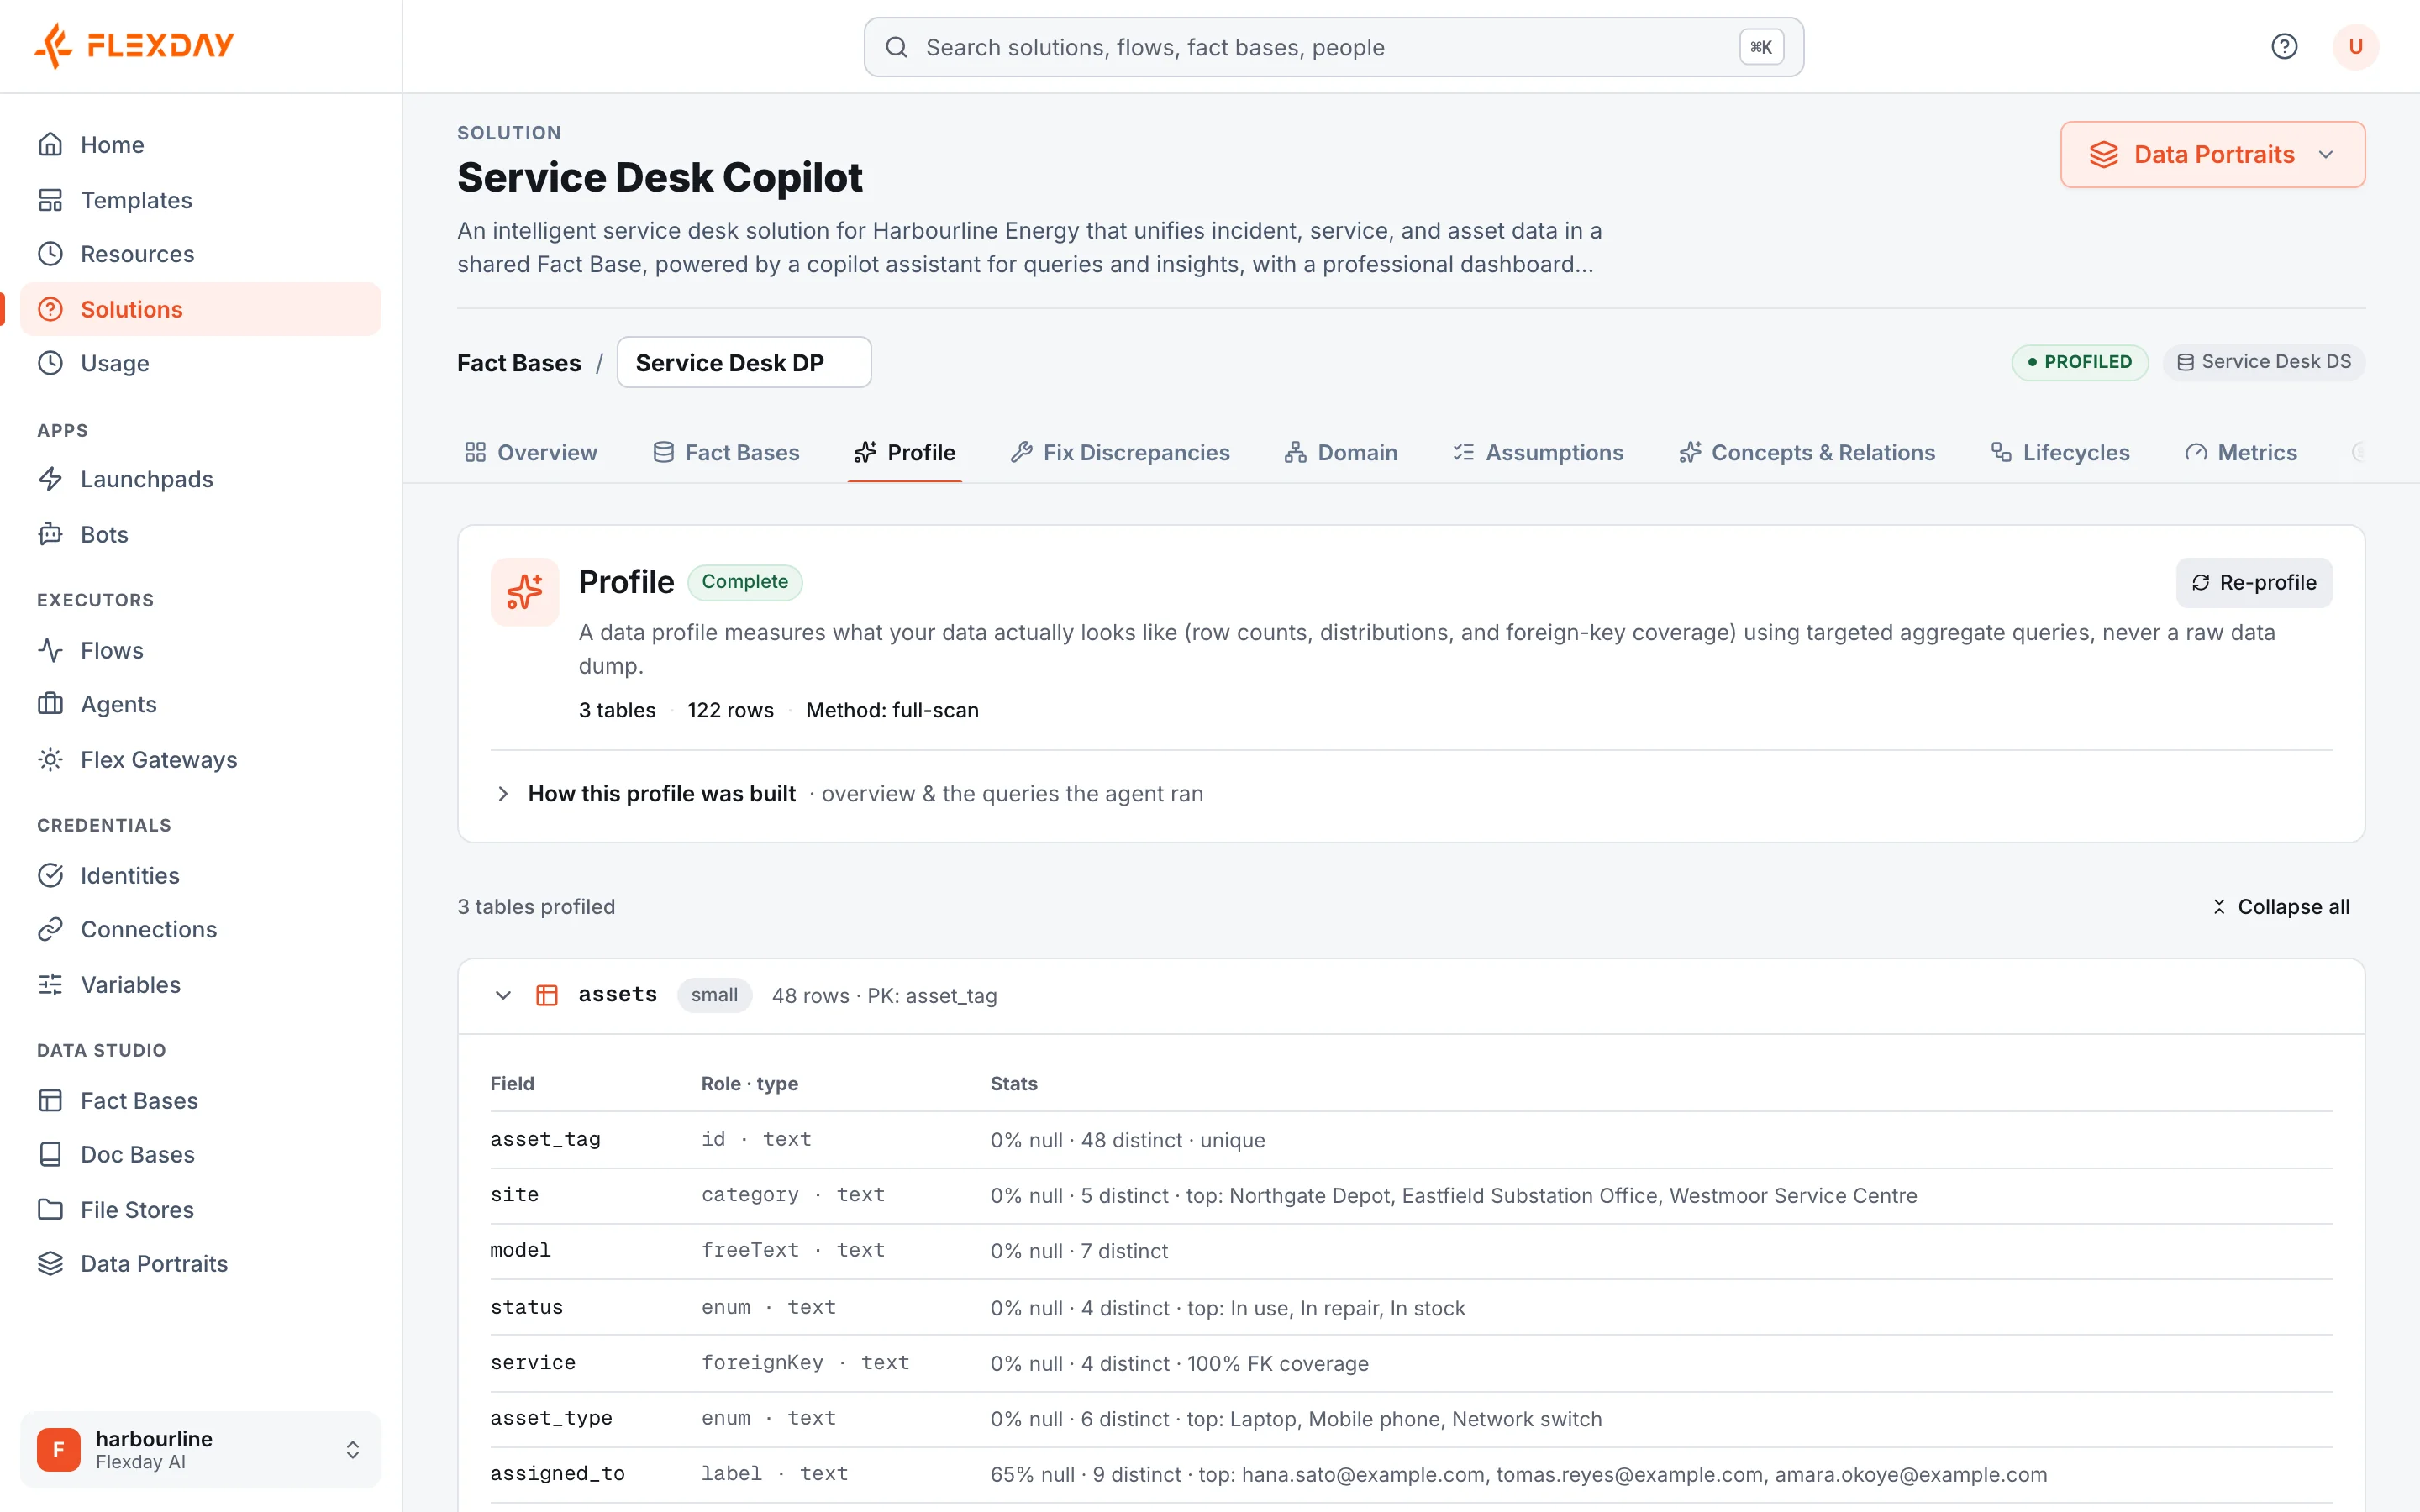
- Find out what the data really says. A Data Portrait measures empty values, distinct values, ranges, averages and percentiles, and flags where the data disagrees with its definition.
- Capture what the data means to the business. The second stage of a Data Portrait describes the domain, concepts, lifecycles, metrics and assumptions, for a person to review and sign off.
- See which queries are slow. Query performance shows run counts and typical and slowest durations for your saved queries.
How it works
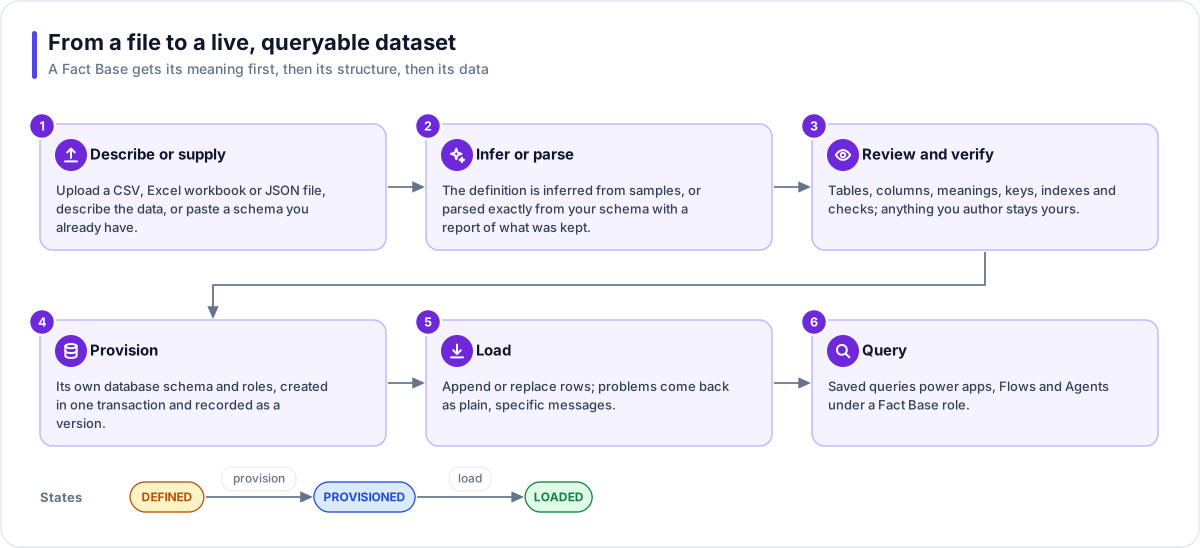
- Describe or supply. Sample JSON, a JSON or CSV file attached in the Builder, or a
CREATE TABLEscript. - Infer or parse. AI infers the meaning from sample data; a schema you paste is parsed as it is.
- Review and verify. You answer open questions, adjust indexes, checks and relationships, and mark each table verified; a Fact Base the Builder creates is marked verified for you.
- Provision. One all-or-nothing step creates the Fact Base's own database schema with its keys and constraints, plus reader and writer roles. A version is recorded.
- Load. Rows are checked against the definition and appended or replaced; every violation is named. A replace never empties a table nobody named.
- Query. Saved queries become the data source for LaunchPads, Flows and Agents.
Dashboards are generated apps. The Builder writes a LaunchPad with charts, tables, maps and headline figures that call the saved queries through the Flex Gateway, so the app never holds a database address or a credential. An Agent granted a Fact Base can answer questions such as "how many orders shipped late last week?" by running read-only queries under a Fact Base role, the reader role by default.
Note
A Data Portrait's profile is instructed to ask aggregate questions only (counts, minimums, maximums, groupings), and it can run only read-only queries, each returning at most 20 rows. The ontology stage has no database access: it works from the definition and the profile.
Example
A retail chain with 140 stores exports its weekly sales as a CSV file and asks the Builder for "a dashboard of sales against target by region and store, with a table of stores that missed target". The Builder creates the Fact Base, saves the queries and deploys the app. The finance analyst then runs a Data Portrait: the profile shows that the discount column is empty for a large share of rows and that a status field holds more values than the definition listed, and she accepts both findings into the definition. The signed-off ontology defines "net sales" in the business's own words, and the Builder uses it when she later asks for a margin view.
Who uses it
| Persona | How they use it |
|---|---|
| Business user | Turns a spreadsheet export into a shared dashboard |
| Analyst | Verifies the definition, writes saved queries and runs Data Portraits |
| Developer | Imports an existing schema, adds roles and row policies, and exposes queries as endpoints |
| IT and security | Relies on per-dataset database roles, row policies and all-or-nothing schema changes |
| Functional user | Gets one agreed definition of each metric they own, behind every dashboard and assistant |